Socks
The category level shows item performance and comparison within the category. Click any plot image for full size.
Item listing
| Item | Price | Times worn | Cost per wear | Wers per month | Status | |
|---|---|---|---|---|---|---|
 | Happy Socks black, monkey disco | 6.90 € | 46 | 0.15 € | 0.8 | Active |
 | Happy Socks black, orange cherries | 6.90 € | 41 | 0.17 € | 0.8 | Active |
 | Happy Socks black with flamingoes | 5.00 € | 38 | 0.13 € | 0.8 | Active |
 | Happy Socks yellow and pink | 8.90 € | 37 | 0.24 € | 0.4 | Active |
 | Unkown skulls | 8.90 € | 35 | 0.25 € | 0.4 | Active |
 | Happy Socks turqoise, blue checkrd | 9.00 € | 33 | 0.27 € | 0.4 | Active |
 | Happy Socks rainbow | 8.90 € | 31 | 0.29 € | 0.3 | Active |
 | North Bend shaftless white 01 | 8.95 € | 29 | 0.31 € | 0.4 | Active |
 | North Bend shaftless white 02 | 8.95 € | 29 | 0.31 € | 0.4 | Active |
 | North Bend shaftless white 03 | 8.95 € | 29 | 0.31 € | 0.4 | Active |
 | Happy Socks ducks | 8.90 € | 28 | 0.32 € | 0.4 | Active |
 | North Bend shaftless white 04 | 8.95 € | 28 | 0.32 € | 0.3 | Active |
 | North Bend shaftless white 05 | 8.95 € | 28 | 0.32 € | 0.3 | Active |
 | North Bend shaftless white 06 | 8.95 € | 28 | 0.32 € | 0.3 | Active |
 | Workwear shaftless black 01 (Hanko) | 1.80 € | 26 | 0.07 € | 0.3 | Active |
 | Workwear shaftless black 02 (Hanko) | 1.80 € | 26 | 0.07 € | 0.3 | Active |
 | Workwear shaftless black 03 (Hanko) | 1.80 € | 26 | 0.07 € | 0.3 | Active |
 | Workwear shaftless black 04 (Hanko) | 1.80 € | 26 | 0.07 € | 0.3 | Active |
 | Happy Socks blck, wht, yellow checkered | 6.90 € | 25 | 0.28 € | 0.5 | Active |
 | Happy Socks blck, wht, yellow checkered 2 | 5.00 € | 25 | 0.20 € | 0.6 | Active |
 | Happy Socks navy with colorful balls | 5.00 € | 25 | 0.20 € | 0.6 | Active |
 | Happy Socks navy with colorful balls 2 | 5.00 € | 25 | 0.20 € | 0.6 | Active |
 | Workwear shaftless black 05 (Hanko) | 1.80 € | 25 | 0.07 € | 0.3 | Active |
 | Happy Socks petrol pink striped | 4.98 € | 23 | 0.22 € | 0.3 | Active |
 | Happy Socks navy with flamingoes | 5.00 € | 22 | 0.23 € | 0.5 | Active |
 | Happy Socks turqoise and white | 8.90 € | 17 | 0.52 € | 0.2 | Active |
 | Happy Socks yellow, gray, blue, red stripes | 5.00 € | 15 | 0.33 € | 0.3 | Active |
 | Happy Socks apples and pears | 8.90 € | 14 | 0.64 € | 0.2 | Active |
 | Happy Socks navy with florals | 5.00 € | 14 | 0.36 € | 0.3 | Active |
 | North Bend shaftl. white 01 (Hanko) | 8.95 € | 13 | 0.69 € | 0.2 | Active |
 | Force black socks Green 1 | 1.00 € | 12 | 0.08 € | 3.9 | Active |
 | North Bend shaftl. white 02 (Hanko) | 8.95 € | 12 | 0.75 € | 0.1 | Active |
 | North Bend shaftl. white 03 (Hanko) | 8.95 € | 12 | 0.75 € | 0.1 | Active |
 | North Bend shaftless black 01 (Hanko) | 2.97 € | 12 | 0.25 € | 0.1 | Active |
 | North Bend shaftless black 02 (Hanko) | 2.97 € | 12 | 0.25 € | 0.1 | Active |
 | Force black socks Orange 0 | 1.00 € | 11 | 0.09 € | 3.6 | Active |
 | North Bend shaftless black 03 (Hanko) | 2.97 € | 11 | 0.27 € | 0.1 | Active |
 | Force black socks Blue 1 | 1.00 € | 9 | 0.11 € | 2.9 | Active |
 | Force black socks Red | 1.00 € | 9 | 0.11 € | 2.9 | Active |
 | Happy Socks sand, white, blue, 3D 2 | 5.00 € | 8 | 0.62 € | 0.2 | Active |
 | Force black socks Green 0 | 1.00 € | 7 | 0.14 € | 2.3 | Active |
 | Force black socks Orange 1 | 1.00 € | 7 | 0.14 € | 2.3 | Active |
 | Force black socks Blue 0 | 1.00 € | 5 | 0.20 € | 1.6 | Active |
 | Happy Socks bubbles on blue 02 | 9.00 € | 5 | 1.80 € | 0.1 | Active |
 | Happy Socks turquise, colorful circles | 6.90 € | 3 | 2.30 € | 0.1 | Active |
 | Pier One black 01 | 1.96 € | 3 | 0.65 € | 0.3 | Active |
 | Pier One black 02 | 1.96 € | 3 | 0.65 € | 0.3 | Active |
 | Pier One black 03 | 1.96 € | 2 | 0.98 € | 0.2 | Active |
 | Pier One black 04 | 1.96 € | 1 | 1.96 € | 0.1 | Active |
 | Pier One black 05 | 1.96 € | 1 | 1.96 € | 0.1 | Active |
 | Happy Socks turquoise, petrol, black, 3D 2 | 5.00 € | 0 | 5.00 € | 0.0 | Active |
 | Pier One white 01 | 1.96 € | 0 | 1.96 € | 0.0 | Active |
 | Pier One white 04 | 1.96 € | 0 | 1.96 € | 0.0 | Active |
 | Pier One white 05 | 1.96 € | 0 | 1.96 € | 0.0 | Active |
 | SOC U Hidden 4P Black 01 | 2.50 € | 0 | 2.50 € | 0.0 | Active |
 | SOC U Hidden 4P Black 02 | 2.50 € | 0 | 2.50 € | 0.0 | Active |
 | SOC U Hidden 4P Black 03 | 2.50 € | 0 | 2.50 € | 0.0 | Active |
 | SOC U Hidden 4P Black 04 | 2.50 € | 0 | 2.50 € | 0.0 | Active |
 | SOC U Hidden 4P Black 05 | 2.50 € | 0 | 2.50 € | 0.0 | Active |
 | SOC U Hidden 4P Black 06 | 2.50 € | 0 | 2.50 € | 0.0 | Active |
 | SOC U Hidden 4P Black 07 | 2.50 € | 0 | 2.50 € | 0.0 | Active |
 | SOC U Hidden 4P Black 08 | 2.50 € | 0 | 2.50 € | 0.0 | Active |
 | SOC U Hidden 4P White 01 | 2.50 € | 0 | 2.50 € | 0.0 | Active |
 | SOC U Hidden 4P White 02 | 2.50 € | 0 | 2.50 € | 0.0 | Active |
 | SOC U Hidden 4P White 03 | 2.50 € | 0 | 2.50 € | 0.0 | Active |
 | SOC U Hidden 4P White 04 | 2.50 € | 0 | 2.50 € | 0.0 | Active |
 | SOC U Hidden 4P White 05 | 2.50 € | 0 | 2.50 € | 0.0 | Active |
 | SOC U Hidden 4P White 06 | 2.50 € | 0 | 2.50 € | 0.0 | Active |
 | SOC U Hidden 4P White 07 | 2.50 € | 0 | 2.50 € | 0.0 | Active |
 | SOC U Hidden 4P White 08 | 2.50 € | 0 | 2.50 € | 0.0 | Active |
 | House black socks - Blue 01 | 1.79 € | 81 | 0.02 € | 3.4 | Divested |
 | House black socks - Silver 02 | 1.79 € | 66 | 0.03 € | 2.6 | Divested |
 | Catmandoo black shaftless 43-46 01 | 2.30 € | 60 | 0.04 € | 1.4 | Divested |
 | Catmandoo black shaftless 43-46 02 | 2.30 € | 60 | 0.04 € | 1.4 | Divested |
 | Catmandoo black shaftless 43-46 03 | 2.30 € | 60 | 0.04 € | 1.4 | Divested |
 | Catmandoo black shaftless 43-46 04 | 2.30 € | 60 | 0.04 € | 1.4 | Divested |
 | Catmandoo black shaftless 43-46 05 | 2.30 € | 60 | 0.04 € | 1.4 | Divested |
 | Catmandoo black shaftless 43-46 06 | 2.30 € | 60 | 0.04 € | 1.4 | Divested |
 | Catmandoo black shaftless 43-46 07 | 2.30 € | 60 | 0.04 € | 1.4 | Divested |
 | Catmandoo black shaftless 43-46 09 | 2.30 € | 60 | 0.04 € | 1.4 | Divested |
 | Catmandoo black shaftless 43-46 08 | 2.30 € | 59 | 0.04 € | 1.3 | Divested |
 | House black socks - Silver 01 | 1.79 € | 59 | 0.03 € | 2.4 | Divested |
 | House black socks - Petrol 01 | 1.79 € | 56 | 0.03 € | 2.3 | Divested |
 | House black socks - Gray 01 | 1.79 € | 55 | 0.03 € | 2.1 | Divested |
 | Happy Socks red, blue, blck chckerd 2 | 9.00 € | 44 | 0.20 € | 1.4 | Divested |
 | Happy Socks Black, white, gray pixels | 5.00 € | 36 | 0.14 € | 1.7 | Divested |
 | Happy Socks black, gr, wht striped | 4.98 € | 33 | 0.15 € | 1.5 | Divested |
 | Happy Socks blue and purple | 8.90 € | 32 | 0.28 € | 2.3 | Divested |
 | Happy Socks white orange balls | 9.00 € | 31 | 0.29 € | 0.4 | Divested |
 | Happy Socks black, gray, white chess | 9.00 € | 30 | 0.30 € | 1.6 | Divested |
 | Happy Socks gray and white | 8.90 € | 30 | 0.30 € | 2.2 | Divested |
 | Happy Socks gray white and black | 8.90 € | 30 | 0.30 € | 1.7 | Divested |
 | Happy Socks bubbles on blue 01 | 8.90 € | 29 | 0.31 € | 1.0 | Divested |
 | Happy Socks red, blue, white 3D | 9.00 € | 28 | 0.32 € | 0.9 | Divested |
 | Happy Socks navy with colorful dots | 5.00 € | 27 | 0.19 € | 0.7 | Divested |
 | Devold black Daily light 01 | 8.30 € | 25 | 0.33 € | 2.1 | Divested |
 | Happy Socks blue stripes on white, red | 9.00 € | 25 | 0.36 € | 1.1 | Divested |
 | Devold black Daily light 02 | 8.30 € | 24 | 0.35 € | 2.0 | Divested |
 | Devold black Daily light 03 | 8.30 € | 24 | 0.35 € | 2.0 | Divested |
 | Devold black Daily light 04 | 8.30 € | 24 | 0.35 € | 2.0 | Divested |
 | Devold black Daily light 05 | 8.30 € | 24 | 0.35 € | 2.0 | Divested |
 | Devold black Daily light 06 | 8.30 € | 24 | 0.35 € | 2.0 | Divested |
 | Happy Socks turquoise, petrol, black, 3D | 6.90 € | 23 | 0.30 € | 1.2 | Divested |
 | Happy Socks white balls on blue | 9.00 € | 23 | 0.39 € | 1.7 | Divested |
 | Unknown wool gray pattern | 20.00 € | 23 | 0.87 € | 1.5 | Divested |
 | Happy Socks Black, white, gray stripes | 5.00 € | 22 | 0.23 € | 1.5 | Divested |
 | Happy Socks grays, white salmiak | 8.90 € | 22 | 0.40 € | 1.6 | Divested |
 | Happy Socks black, gray, white 3D | 9.00 € | 21 | 0.43 € | 1.4 | Divested |
 | Happy Socks Blue, gray, blck squares | 5.00 € | 20 | 0.25 € | 1.1 | Divested |
 | Unkown plain black | 5.00 € | 20 | 0.25 € | 1.8 | Divested |
 | Happy Socks blue, gray, lght blue salm. | 4.98 € | 19 | 0.26 € | 1.1 | Divested |
 | Unknown black and grey salmiak | 8.90 € | 17 | 0.52 € | 1.1 | Divested |
 | Happy Socks blue red lumber jack | 9.00 € | 16 | 0.56 € | 2.2 | Divested |
 | Mywear shaftless gray (no logo) 01 | 1.60 € | 14 | 0.11 € | 0.3 | Divested |
 | Black grey striped 01 | 3.95 € | 13 | 0.30 € | 1.0 | Divested |
 | Black grey striped 02 | 3.95 € | 13 | 0.30 € | 1.0 | Divested |
 | Black grey striped 03 | 3.95 € | 13 | 0.30 € | 1.0 | Divested |
 | Mywear shaftless gray (no logo) 02 | 1.60 € | 13 | 0.12 € | 0.2 | Divested |
 | Black grey striped 04 | 3.95 € | 12 | 0.33 € | 0.9 | Divested |
 | Dark gray long checkered 01 | 5.00 € | 12 | 0.42 € | 0.5 | Divested |
 | Happy Socks fractal | 8.90 € | 11 | 0.81 € | 2.0 | Divested |
 | Unkown light gray long | 5.00 € | 11 | 0.45 € | 0.6 | Divested |
 | Dark gray long checkered 02 | 5.00 € | 10 | 0.50 € | 0.4 | Divested |
 | Mywear shaftless black (no logo) | 1.60 € | 8 | 0.20 € | 0.4 | Divested |
 | Mywear shaftless white (no logo) 01 | 1.60 € | 8 | 0.20 € | 0.2 | Divested |
 | Mywear shaftless white (no logo) 02 | 1.60 € | 8 | 0.20 € | 0.2 | Divested |
 | Happy Socks purple, red, sand checkered | 5.00 € | 1 | 5.00 € | 0.0 | Divested |
Times worn
Total times worn to date. Green line items are divested, gray still in use. Green areas show 1 and 2 SD ranges for divested items. 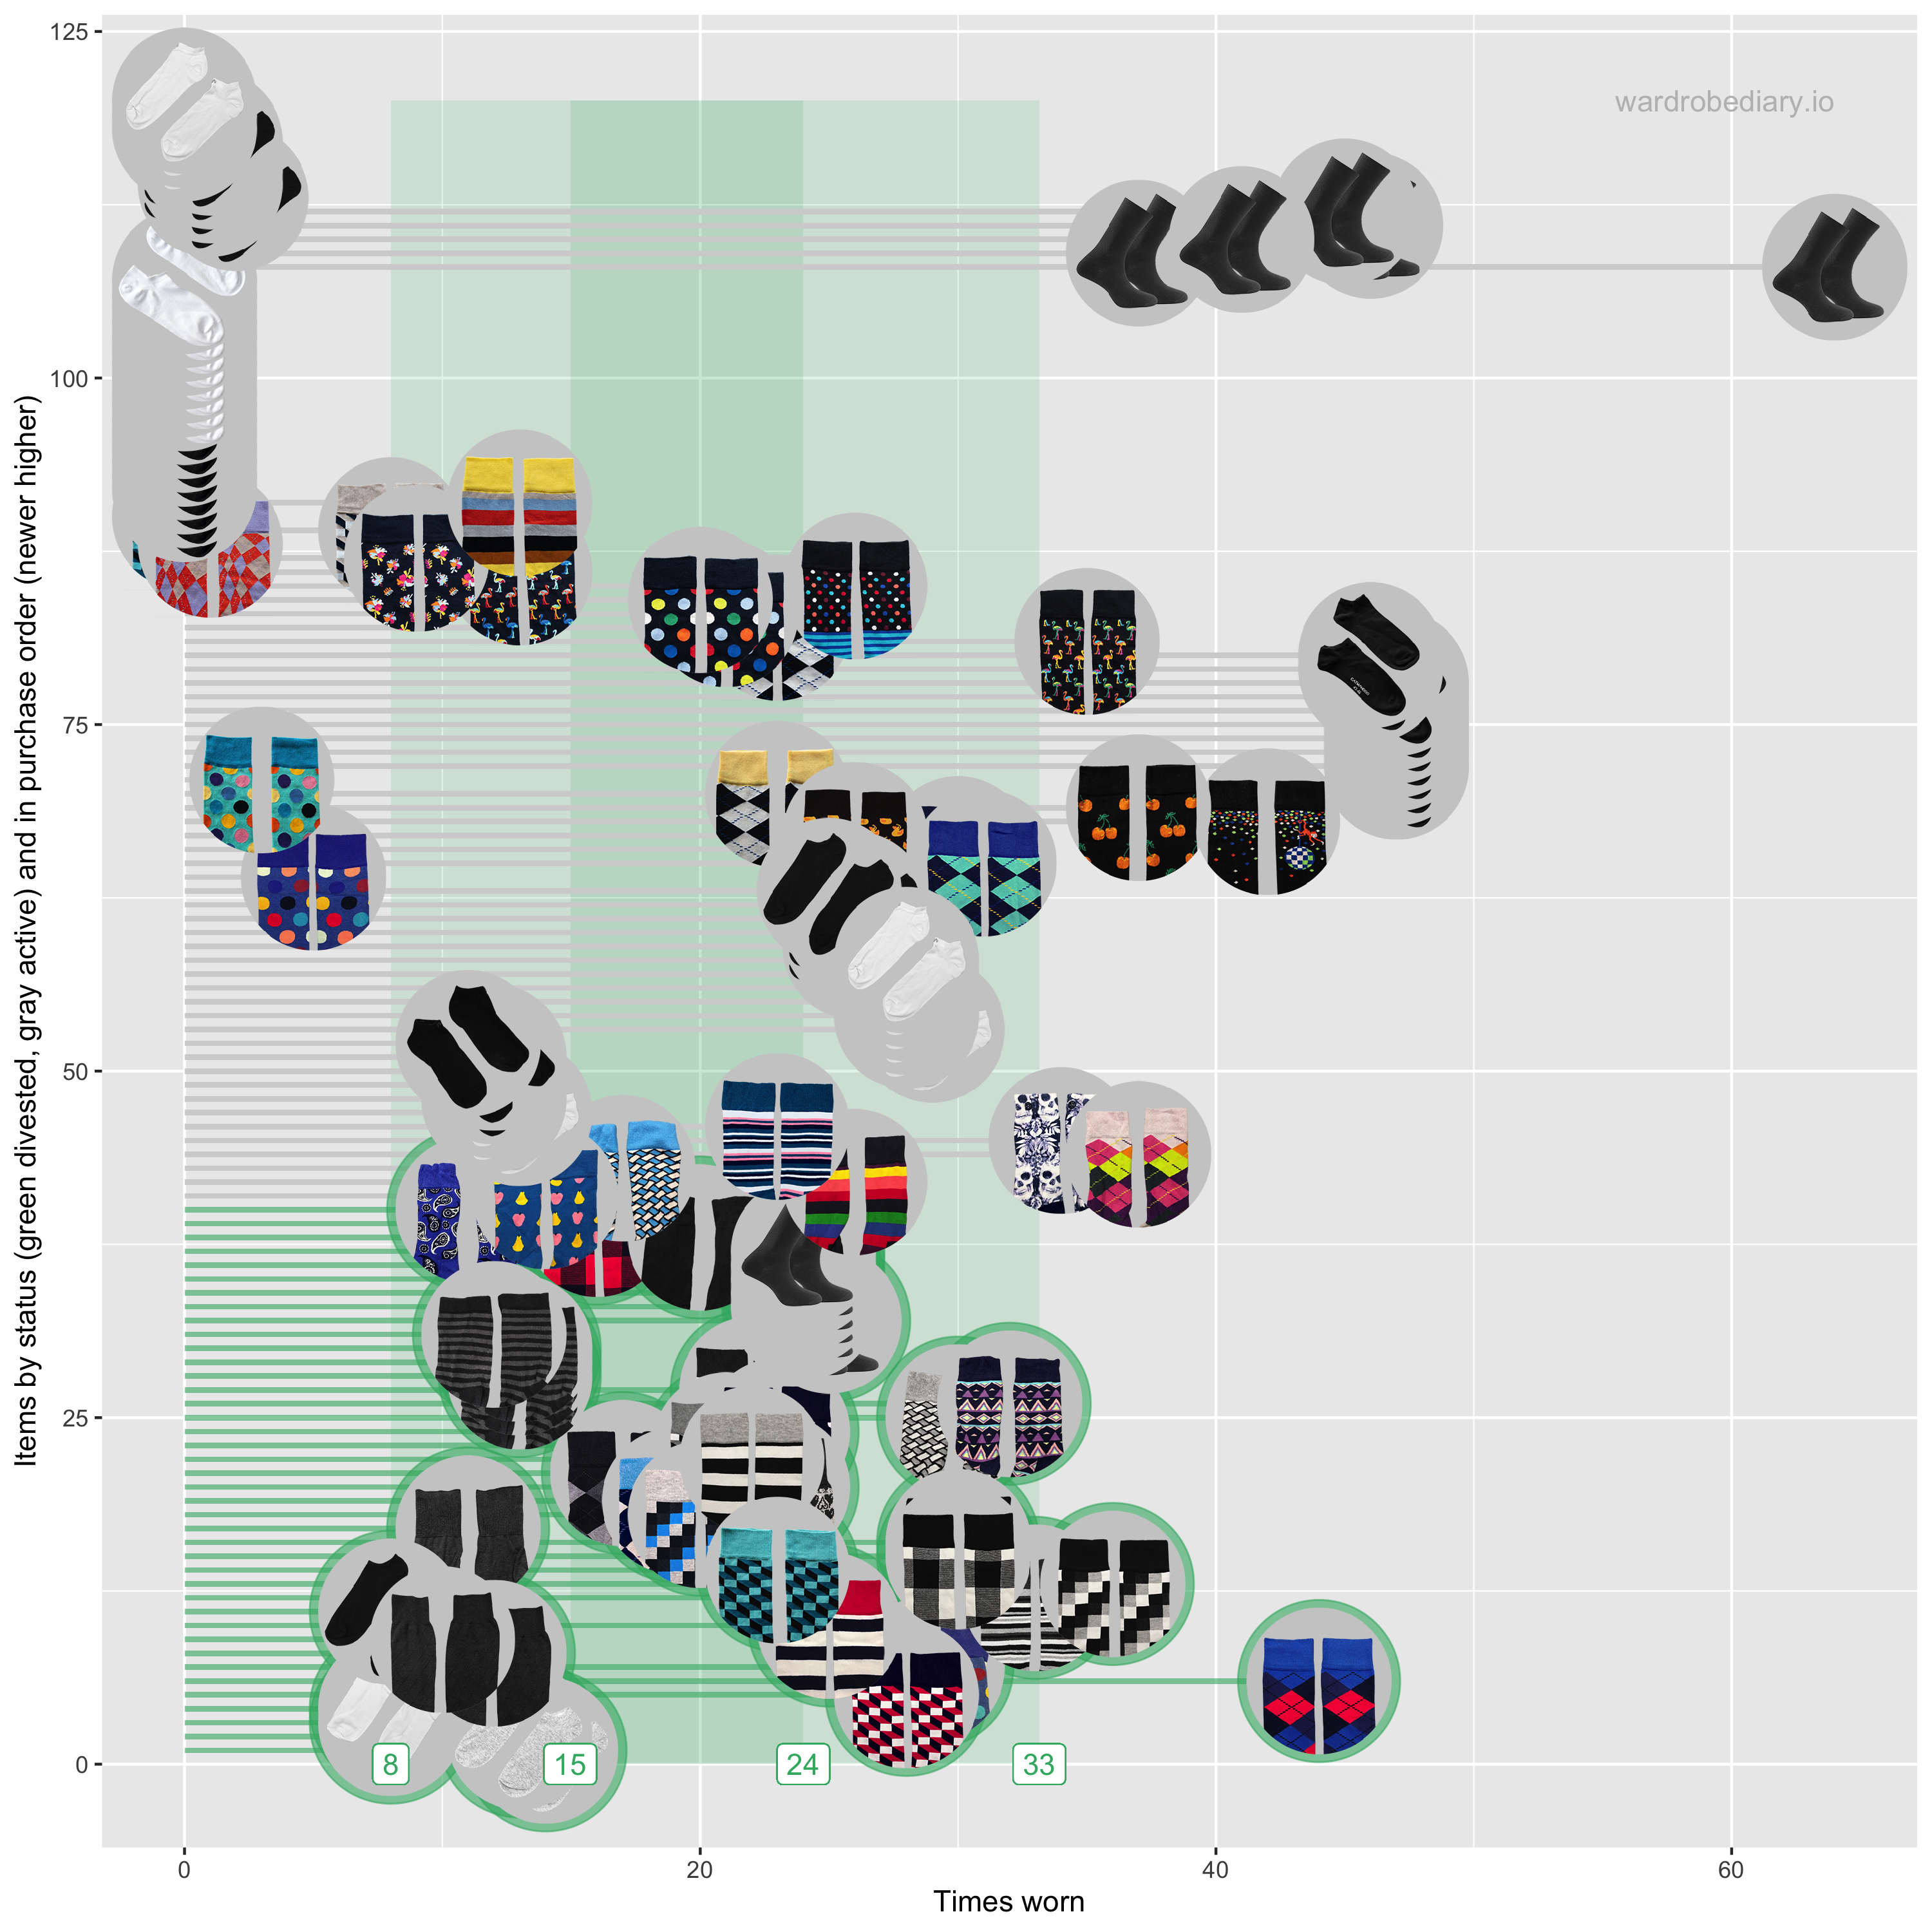
Cost per wear and times worn
Gray dots trace the use of each item. Blue dots are guide trajectories for items with purchase prices of 5, 10, 20, 50, 100, 200, 400, and 800 EUR. 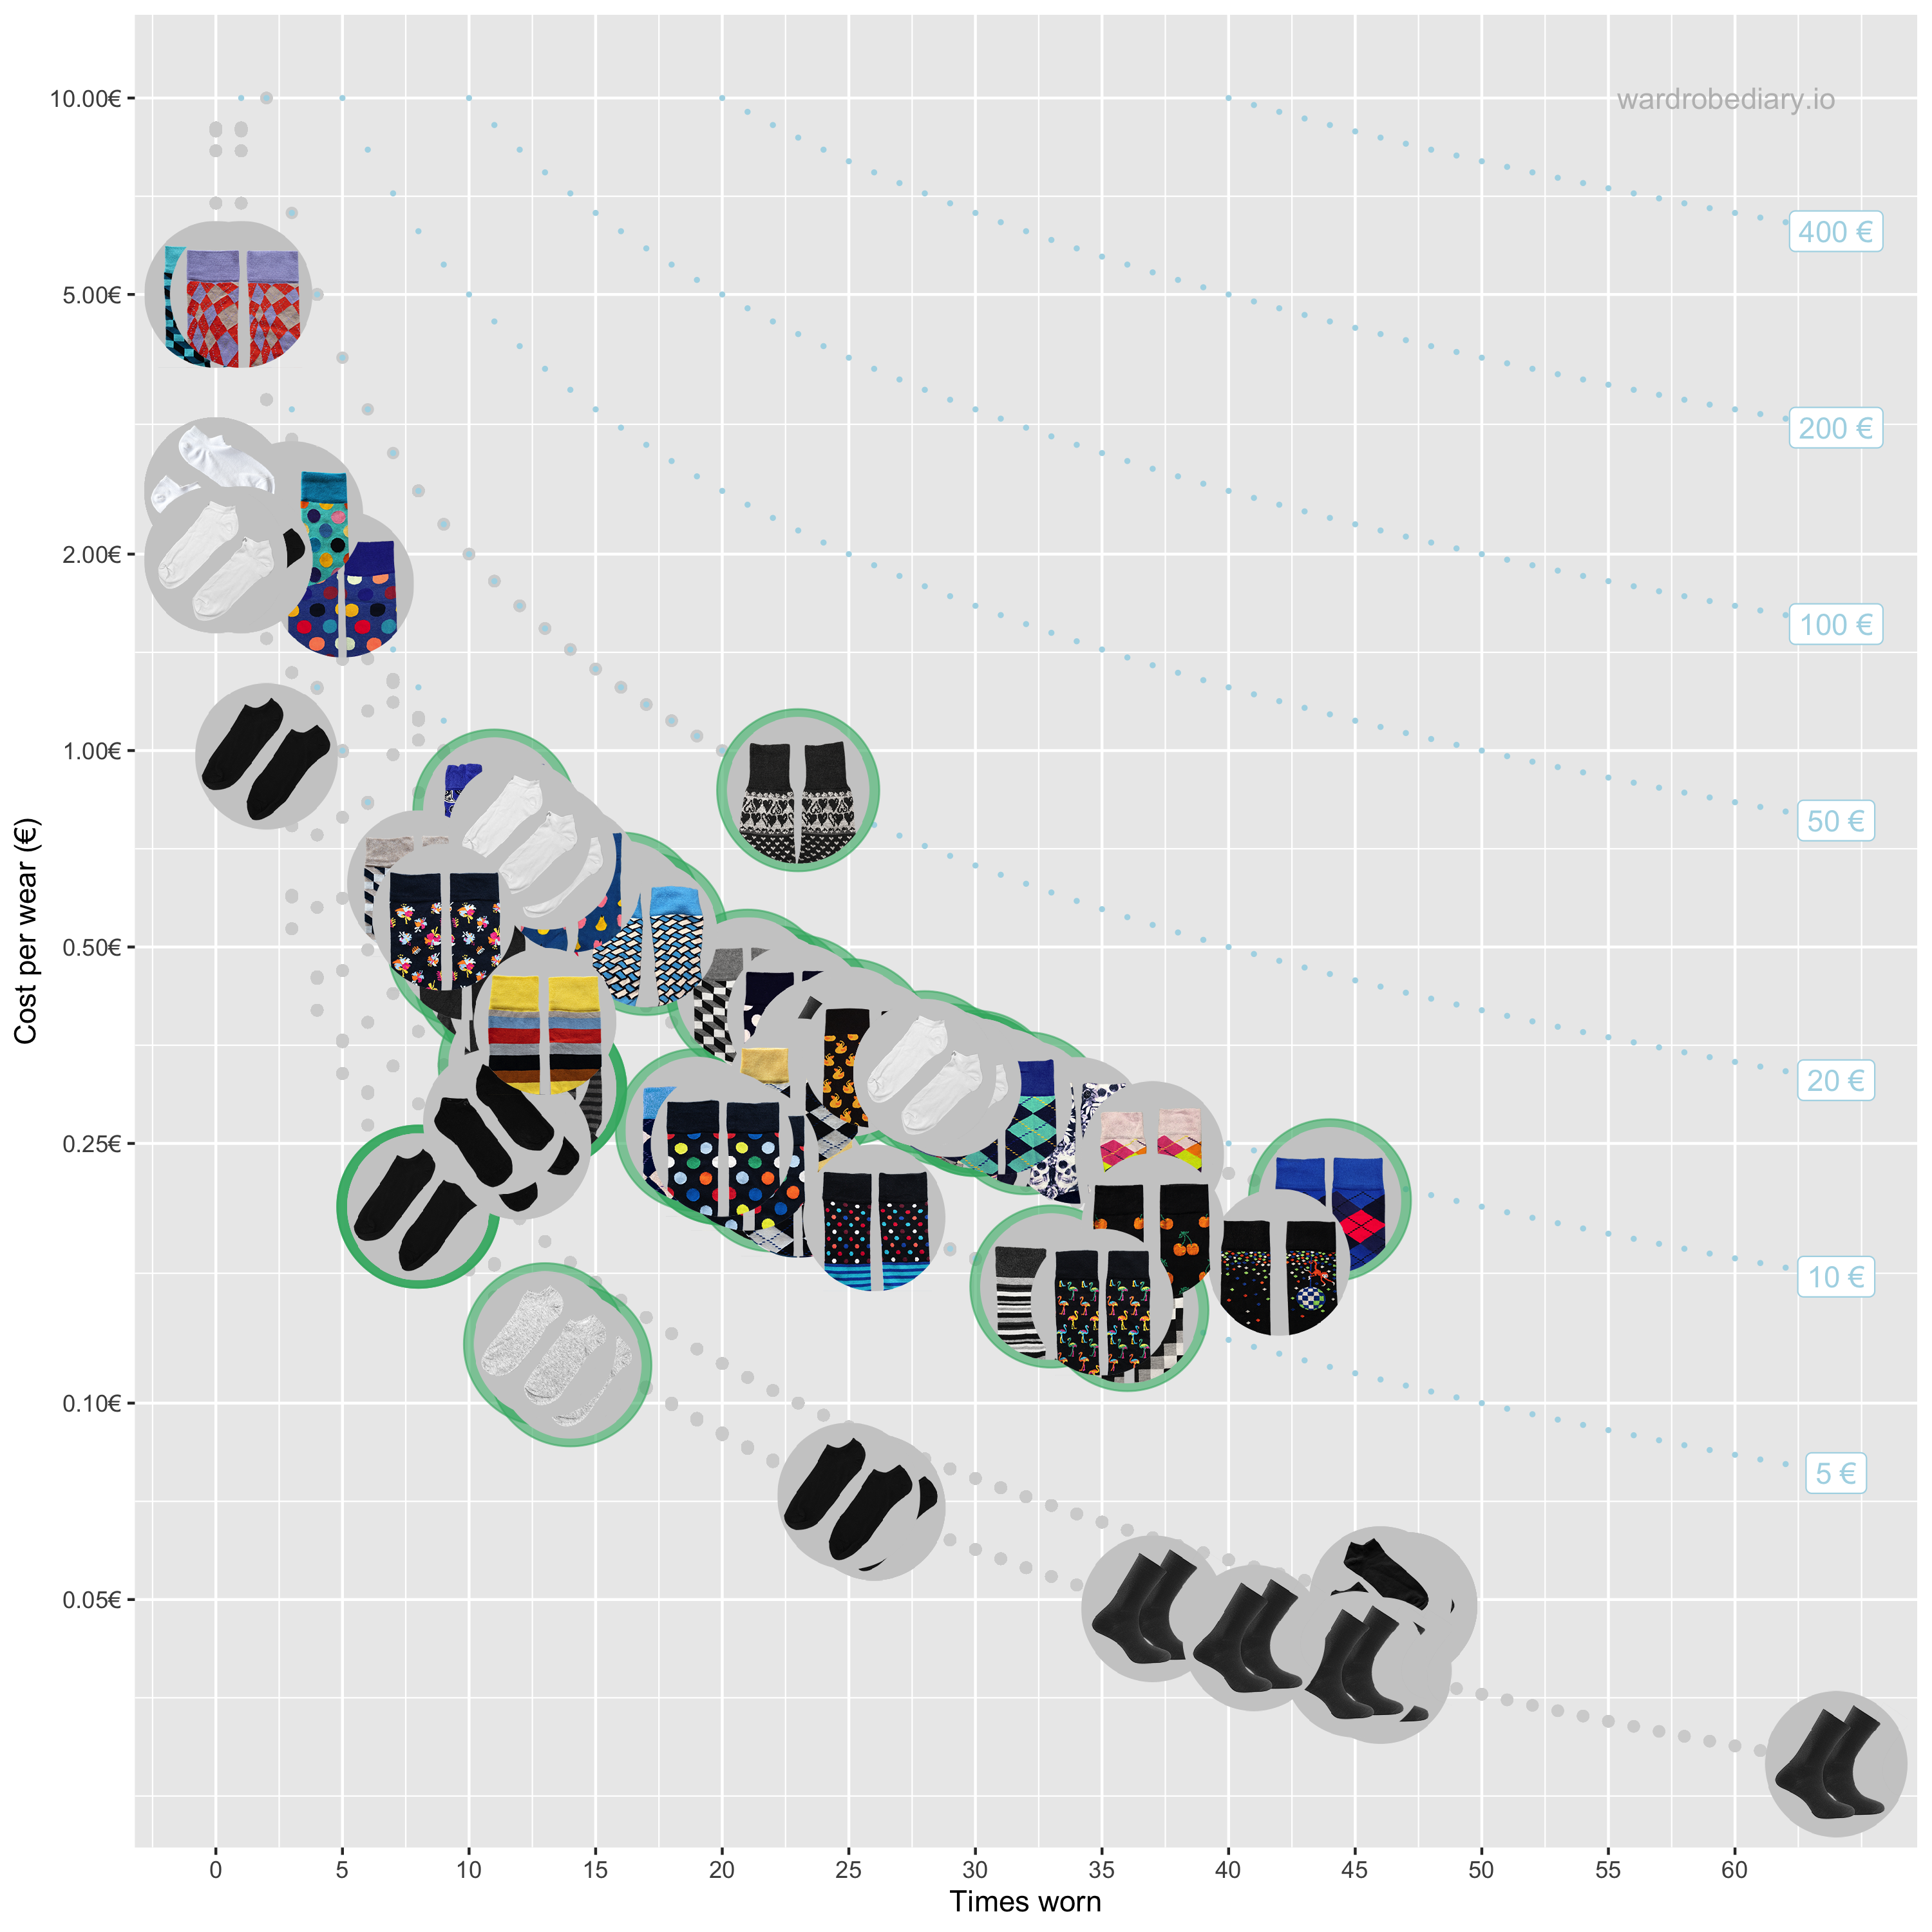
Cost per wear and frequency of use
Dotted lines show average values for the total use to date of all divested items. 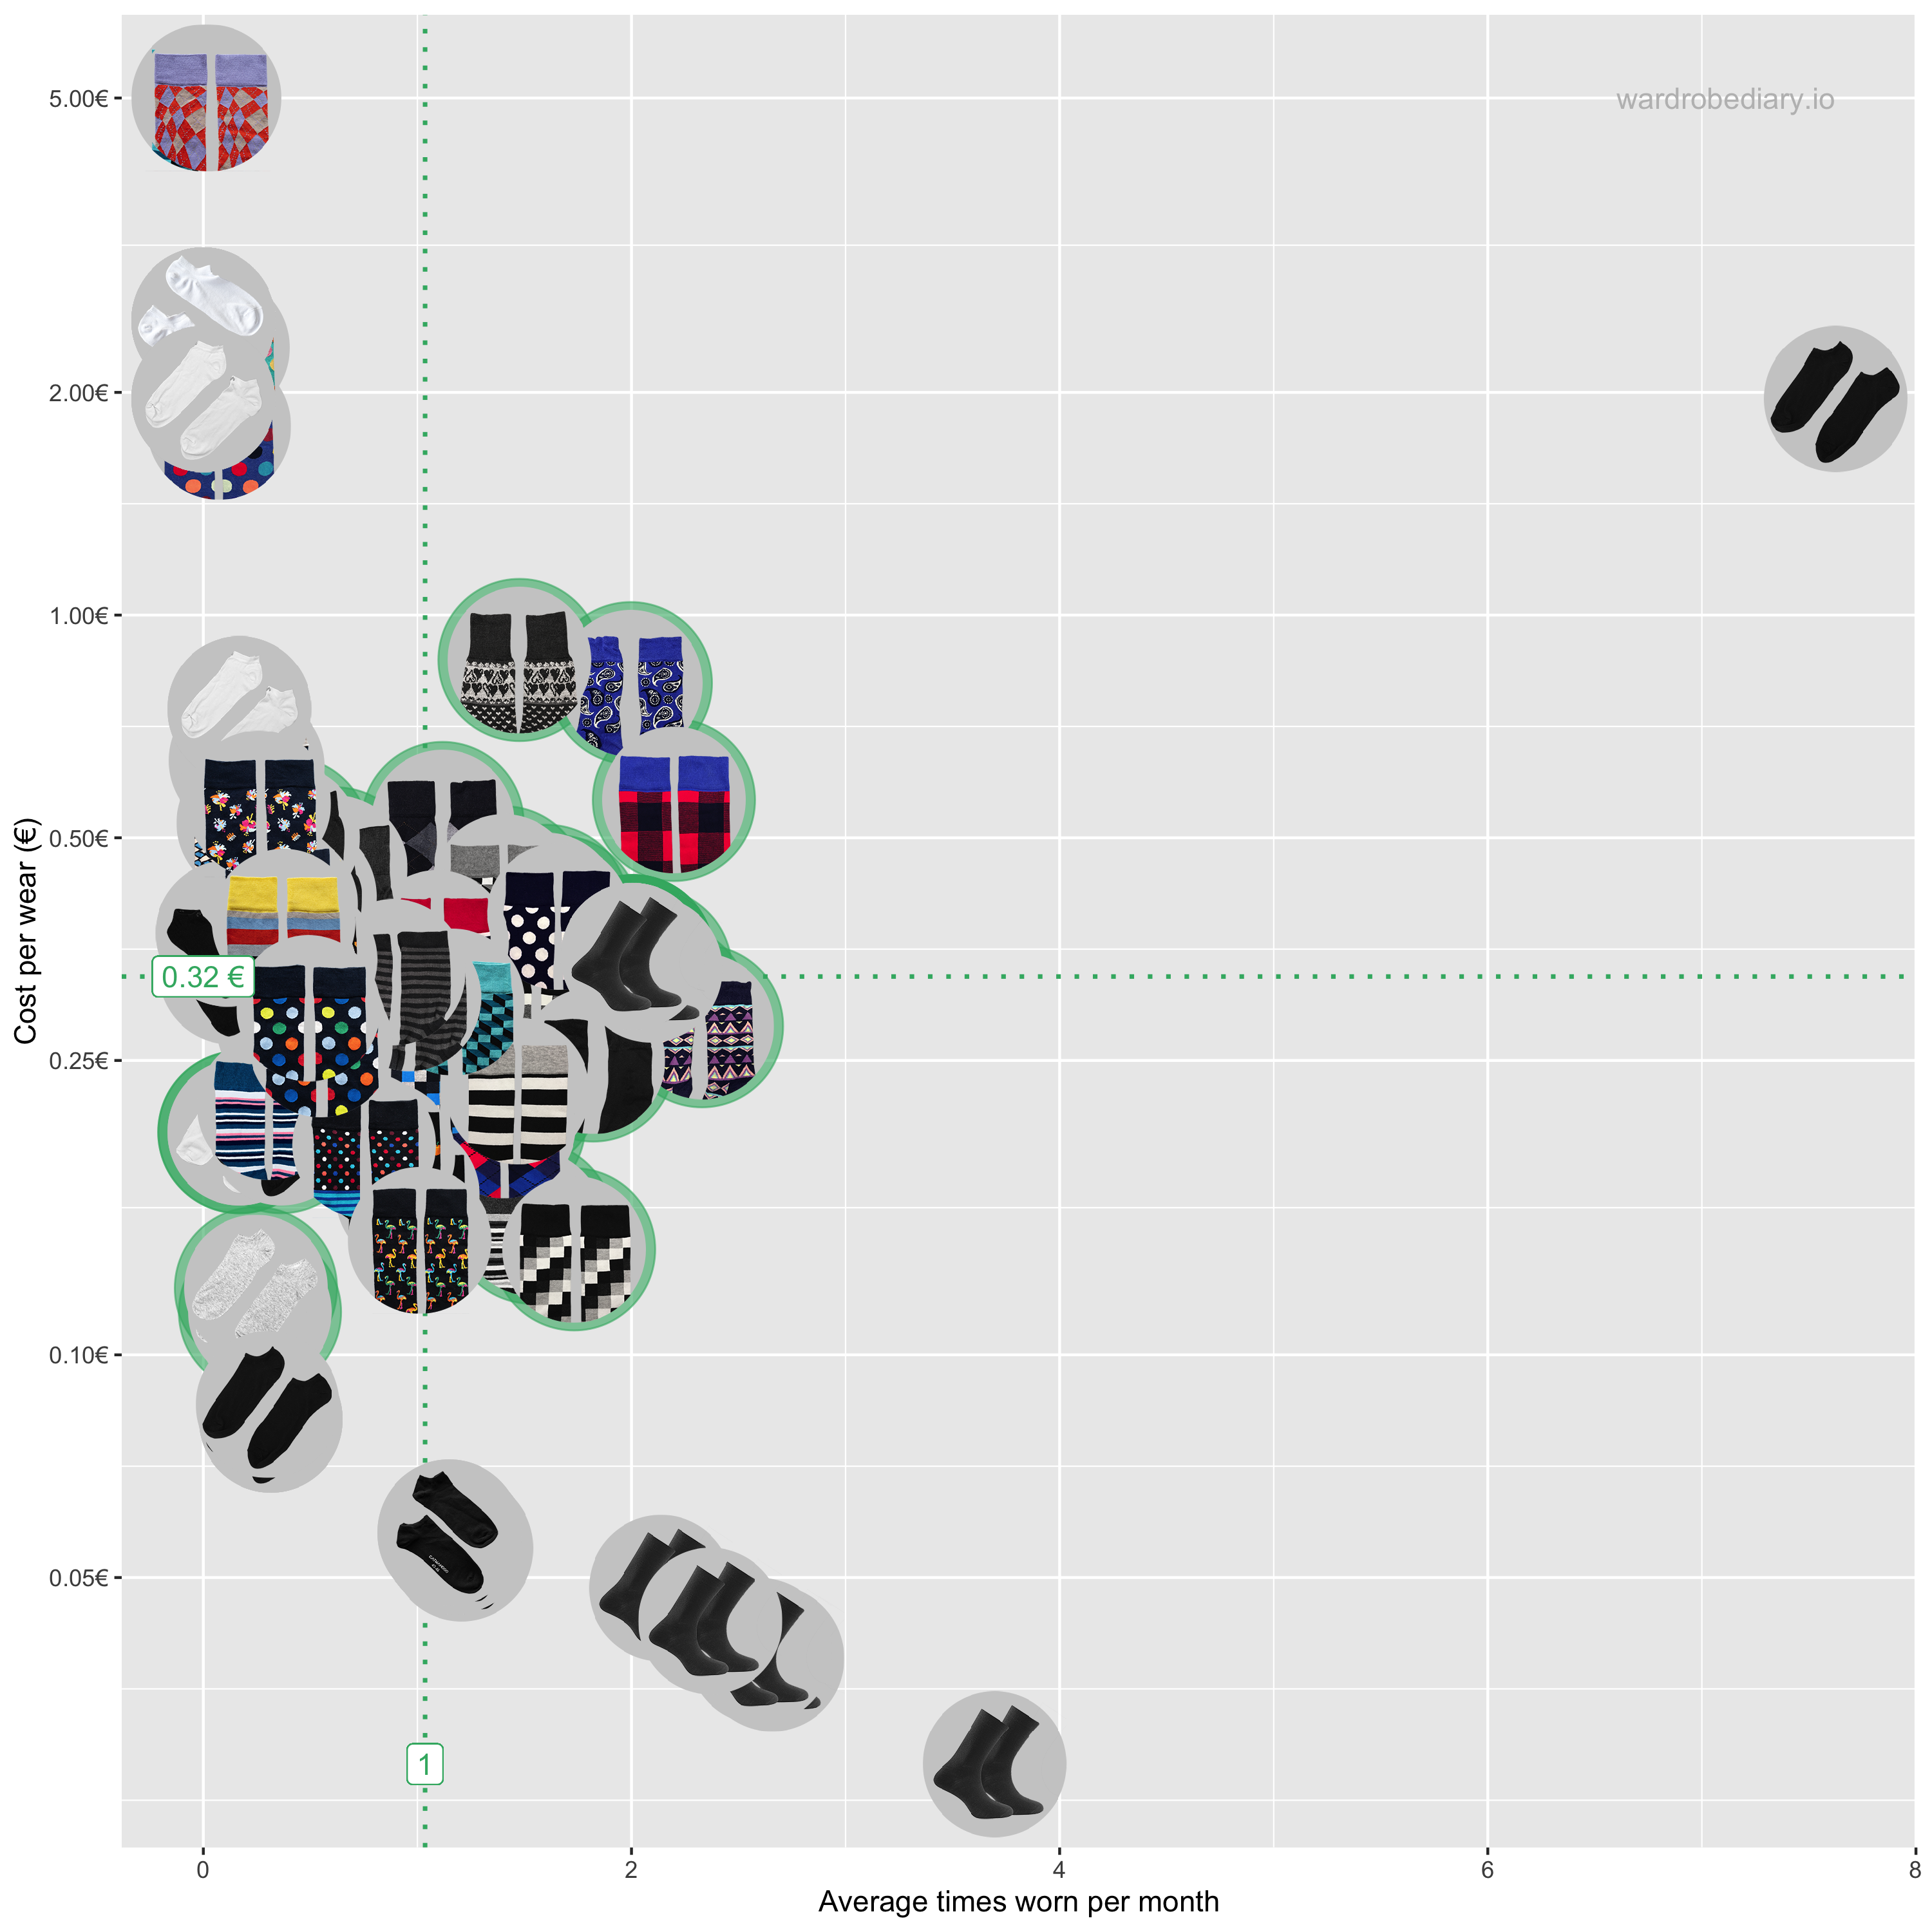
Times worn - Animated by date
Historic progression. Green line items are divested, gray still in use. Green areas show 1 and 2 SD ranges for divested items. 
Cost per wear and frequency of use - Animated by date
Historic progression. Dotted lines show average values for the total use to date of all divested items to that date. 
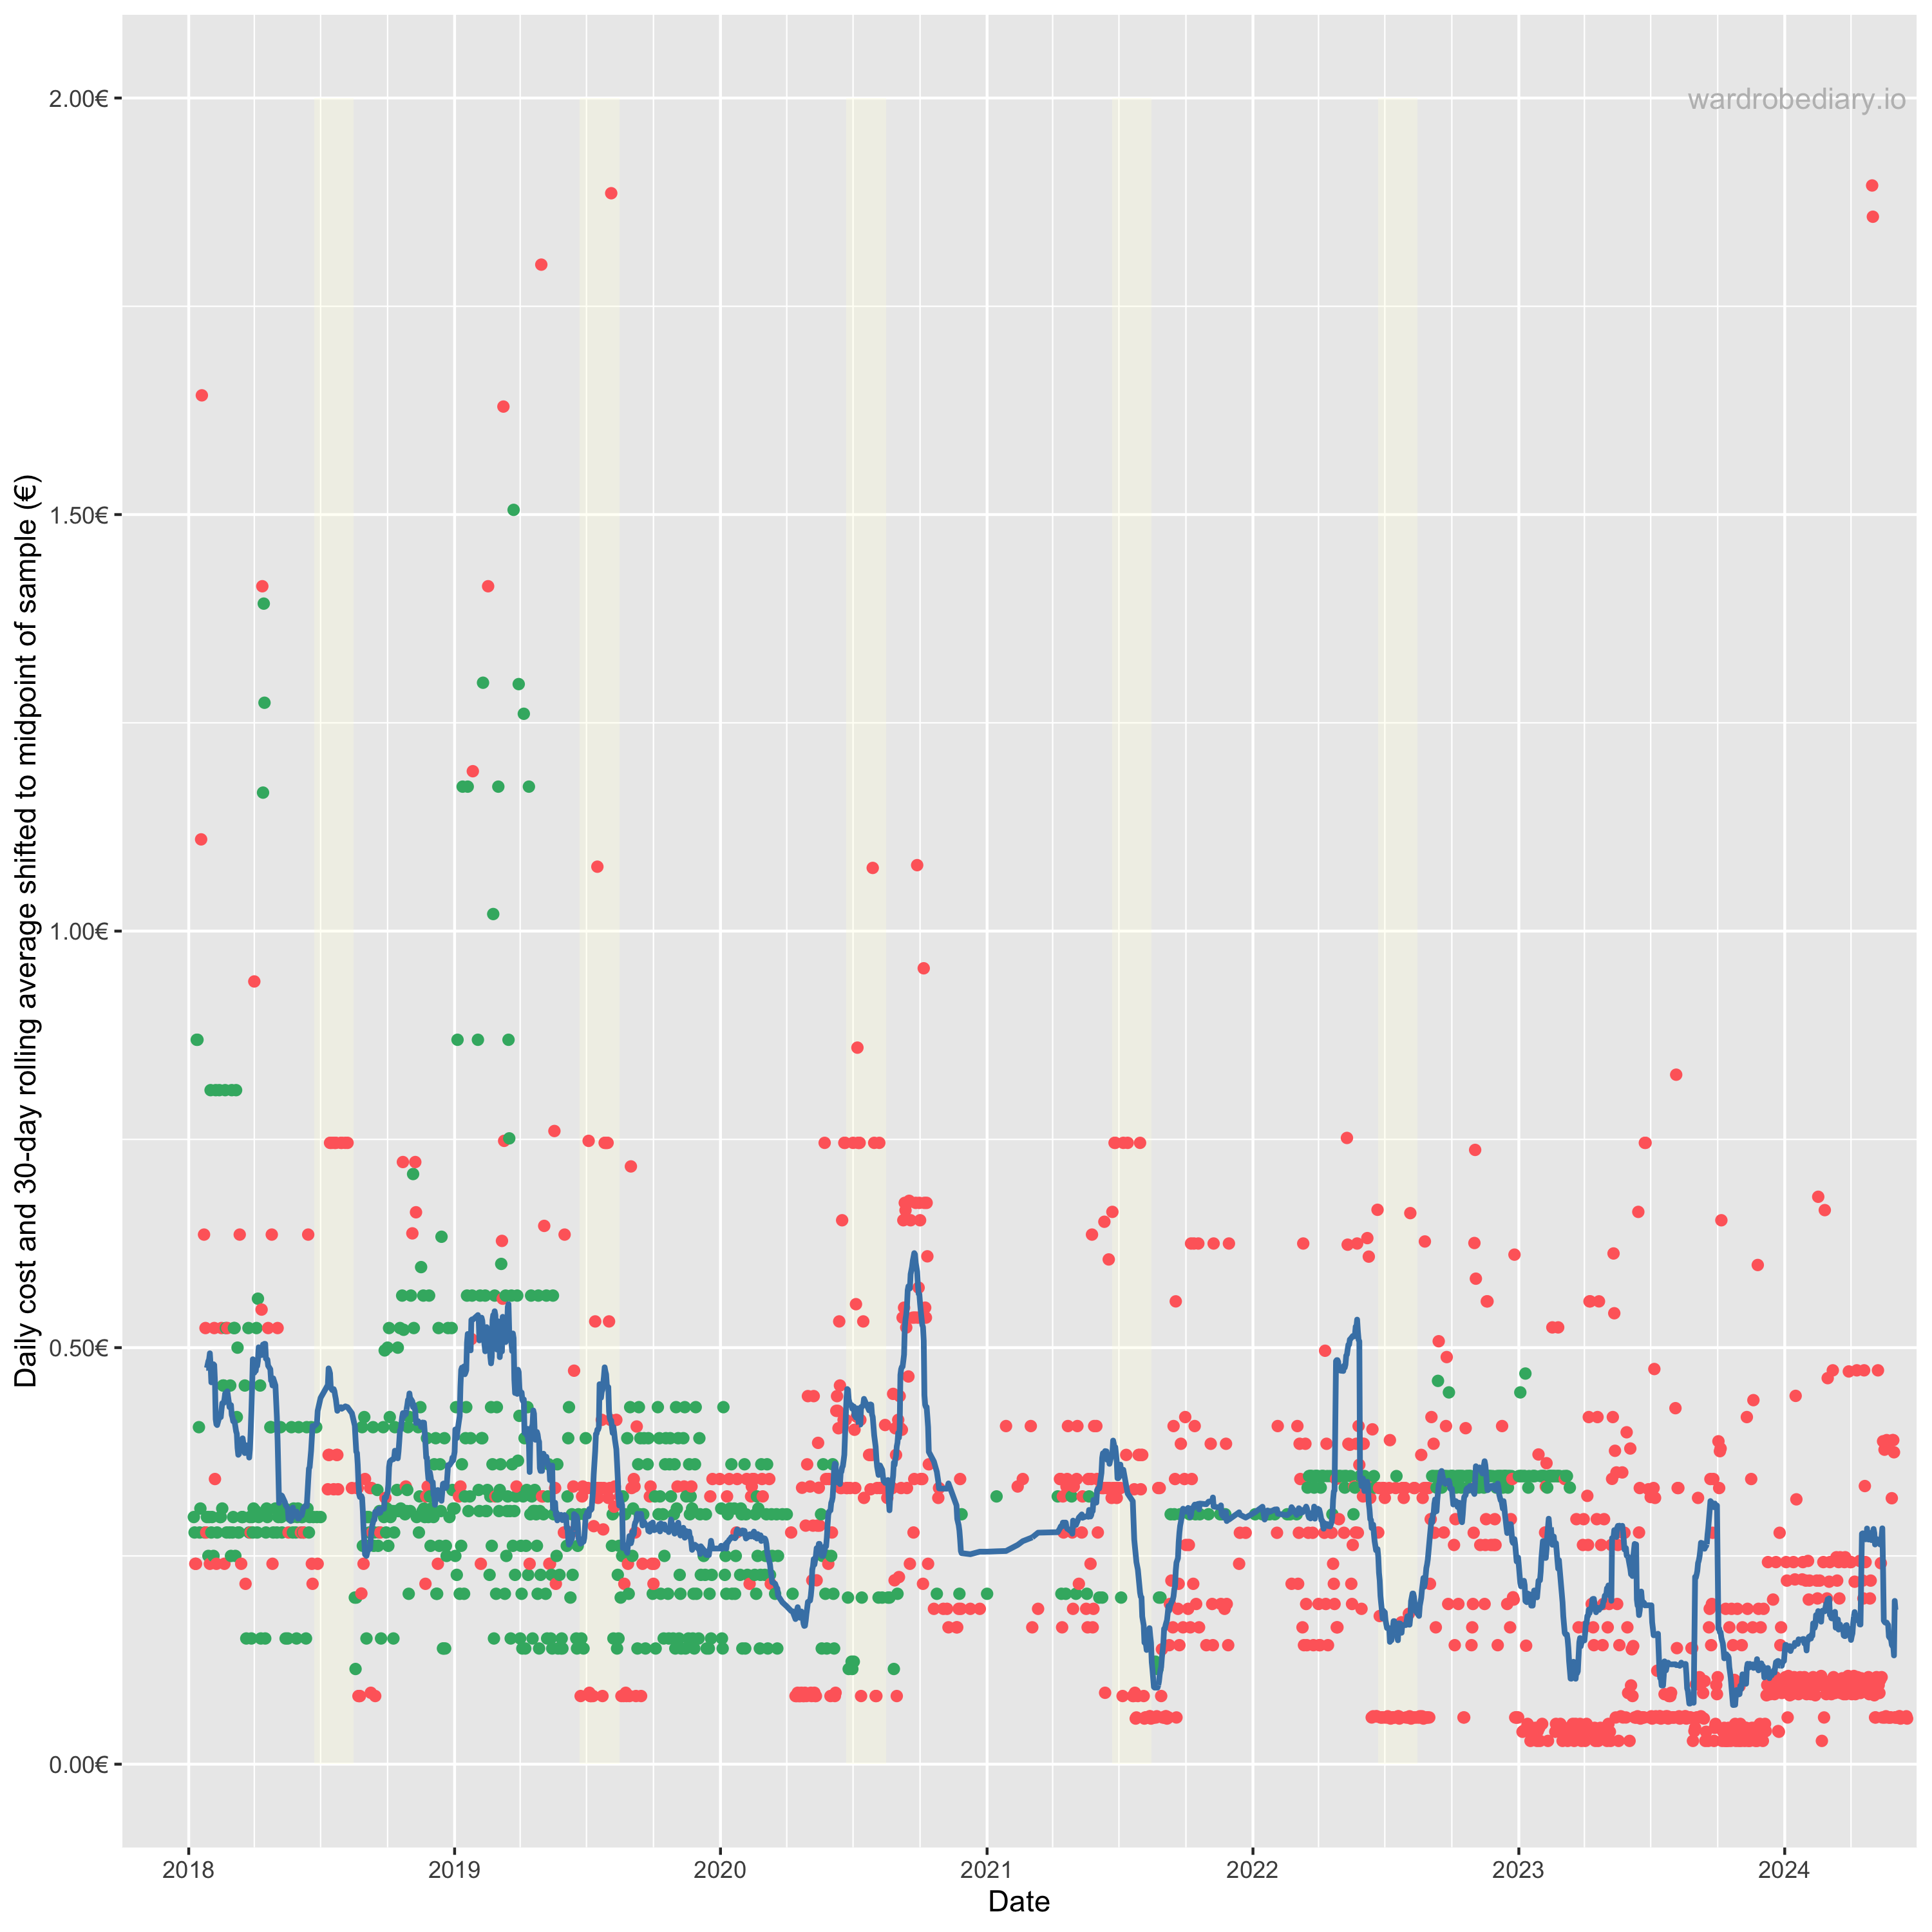
Daily cost
Daily cost of category item(s) worn. Green means the daily cost is final and no longer changes. Red means it may still decrease with future use.